Discover our new wind speed scaling feature for better accuracy in time series analysis and more confident decision-making in wind development.
Scaling with Confidence: New Wind Speed Adjustment for Time Series Analysis
In wind development, precision matters — especially when working with real-time or historical wind data. That’s why we’ve introduced custom wind speed scaling in our time series module: a feature designed to improve accuracy, align with third-party datasets, and give developers more control in early-stage energy assessments.
Why this feature matters for decision-making
Wind development relies on assumptions — but not all datasets are created equal. Being able to align your time series with a specific target mean wind speed means you can:
- Compare different energy yield scenarios on a consistent basis.
- Calibrate inputs to match reference datasets or measurement campaigns.
- Build more realistic LCoE estimates.
- Make design and investment decisions with greater confidence.
This new update doesn’t just modify the input — it ensures your assumptions are reflected across the analysis in a clear and consistent way.
.png?width=1200&length=1200&name=image%20(4).png)
Smarter Control Over Wind Data
With this new feature, users can now define a target mean wind speed, and the platform automatically calculates and applies a scaling factor to the wind time series.
This ensures alignment with your reference assumptions — whether from measurement campaigns, third-party datasets, or predefined development targets.
The adjusted wind data is reflected consistently across:
- Energy yield calculations.
- Wind rose and frequency distribution plots.
- CSV exports.
- Power output charts..
To support transparency, the calculated scaling factor (%) is clearly displayed in the Production Comparison tab.

Better Visualisation for Deeper Insight
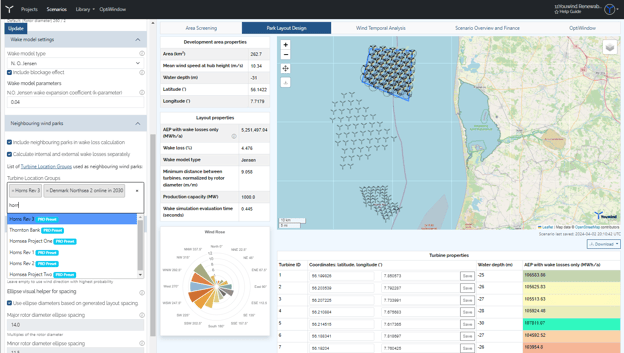
The Wind Analysis page has been restructured to improve usability. Visualisations are now organised into three dedicated tabs:
“Time Series”, “Power Output”, and “Statistics” — making navigation clearer and more focused.
Two new interactive plots have been added under the Power Output tab:
- The first chart displays the relationship between ambient wind speed and power output, with each point colour-coded by wind direction sector.
- The second chart plots wind speed against wind direction, with colours representing power production.

These enhancements make it easier to interpret the behaviour of your dataset and assess model response under varying conditions.
Built for clarity. Backed by expertise.
This update is part of our 2025 roadmap to provide users with more control, greater flexibility, and improved data transparency. It’s also the first in a series of enhancements to our time series analysis capabilities — with more to come soon.