In this article, we give an overview of the latest additions to the Youwind web-based solution:
- Multicompany feature to share libraries and scenarios with different companies
- Visualization and ability to move the offshore substation
- Export cable routing linked from offshore substation to onshore grid connection
- Generate, visualize, and edit the array cable layout
- The possibility of adding a shunt reactor to improve the efficiency of AC export transmission. Now both onshore and offshore
- Updated LCOE table
- Wind map visualization in Area Screening
- Updated wind farm areas and GIS layers in Colombia, South Africa, and other emerging markets
As always, you can write to info@youwindrenewables.com to get further information or help from our offshore wind experts.
 The user from Company B accepts the invitation and then becomes a part of the list of users in Company A.
 Then the user from Company B has access to both A and B and can switch between companies:
 By switching companies the user has direct access to the different companies through the same login. This can be seen in the profile overview also where the user can click which company to have access to at each moment under My Companies:
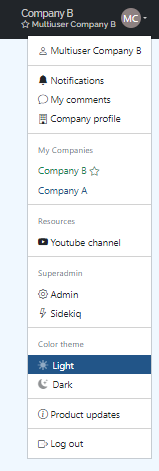 If the user should be removed from the account then it is enough to simply hit the button "remove this user".
  Note that the user from Company A can not access Company B as no invitation has been sent and the data is kept as secure as before. Please, contact us to know more about this functionality!
Visualization and ability to move the Offshore Substation
Previously the offshore substation (OSS) was used to calculate the cost of the platform and lengths of export cables and array cables by being placed in the centroid of the site (pixel).
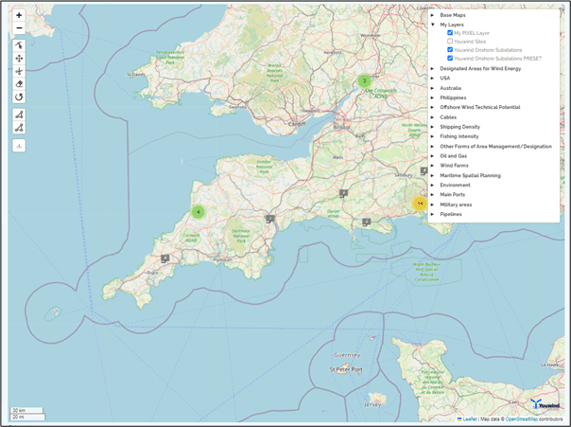
Now, the user will be able to see and manually move the offshore substation on the map or add more substations.
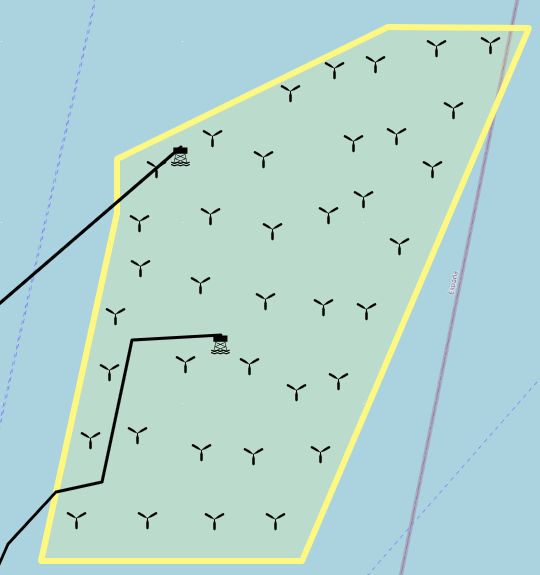
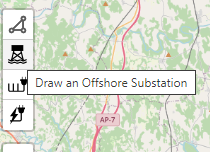
The offshore substations can also be moved or deleted on the map using the existing tools. You can add as many offshore substations to the map as are required for the project using the new toolbox for cable layout:
The number of offshore substations and the budget will be updated automatically.
The export cable routs will also be updated after rearranging the offshore substations.
Export cable routing
By adding an offshore substation to the map, the export cable is automatically drawn. The number of export cables is determined by the scenario production capacity and the cable capacity set at the export cable library chosen.
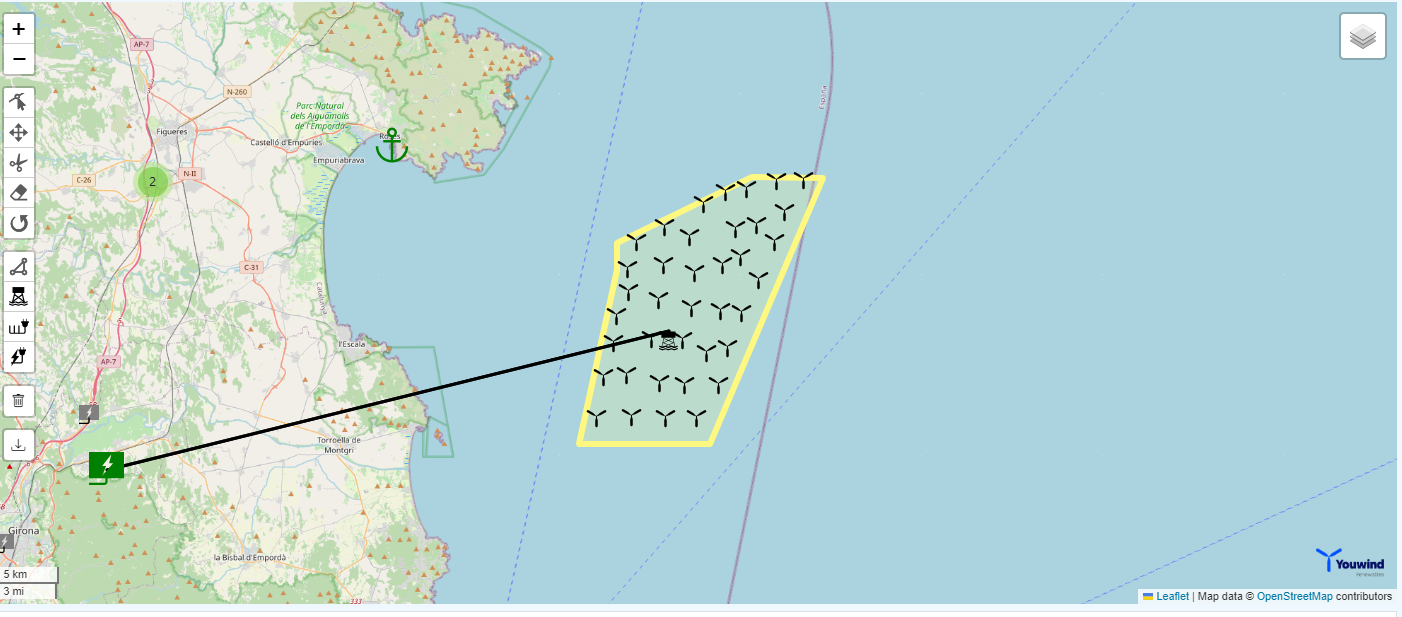
The generated export cables can be edited and deleted using the existing tools.
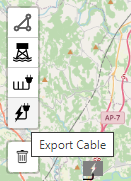
Additional export cables can also be drawn using the new toolbox for cable layout:
By editing the export cables, routing can be evaluated in more detail than before. On the cable route, there could be human or environmental restrictions that are worthwhile considering.
The number of export cables, cable length, cable loss, and availability including budget will update automatically.
Generate and visualize the Array cable layout
Previously the array cable layout was calculated considering the number of turbine positions, offshore substations, size of development area, and bathymetry and it calculated the overall cable length. This was done for the static and dynamic part of the cable.
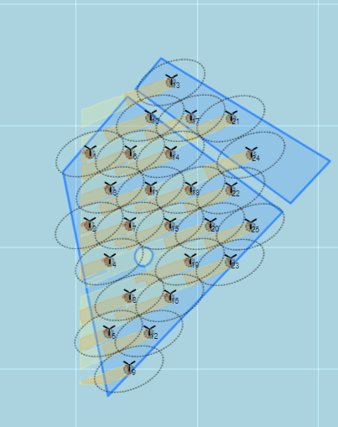
Now, this can be done by clicking the "generate array cable layout" at the left sidebar in Area screening to visualize the array cable layout.
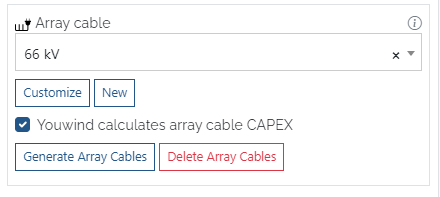
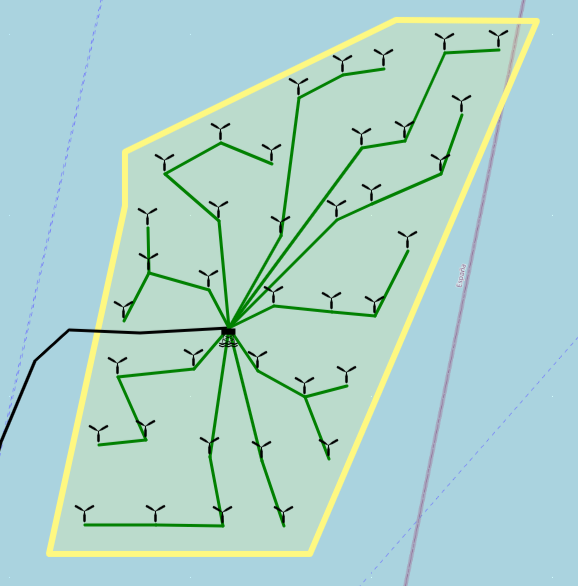
After clicking this button, the array cable layout is generated and connected to the offshore substations of the wind farm ensuring the maximum number of turbines per string, which is determined by the array cable capacity and the turbine-rated power, is not exceeded. For example, if the cable capacity is 80MW and 10MW turbines are used, then the maximum number of turbines per string is 8 and the generated layout will not exceed this.
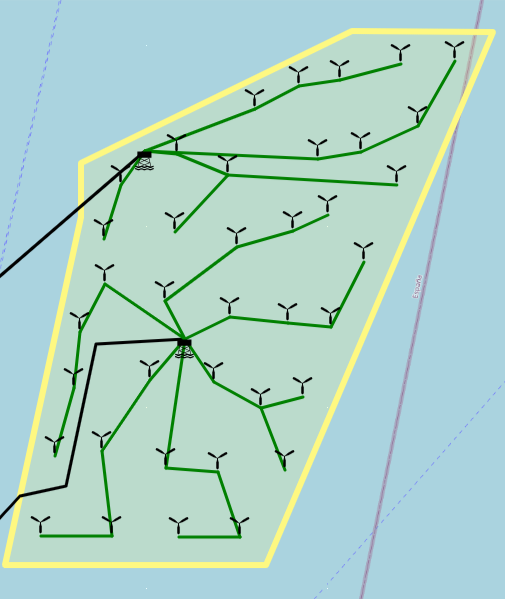
Where multiple substations are present, turbines are split into groups for each substation. We keep the number of turbines connected to each substation similar, while also connecting as many turbines as possible to the closest substations.
For each substation, we then generate an array cable layout by grouping nearby turbines into strings and connecting them to the substation
This applies both to fixed bottom and floating array cable layouts. Note that the bathymetry is also taken into account in the total array cable length.
The array cables can also be edited, deleted, and then redrawn on the map using the new toolbox for array cable layout:
When changing a parameter of the wind farm such as the park layout or the number of offshore substations, you can regenerate the array cable layout to match the new parameters with Generate Array Cables which will delete any previous array cables before generating a new layout.
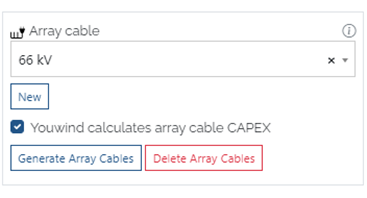
By editing the array cables, the routing can be evaluated in more detail than before. On the cable route, there could be human or environmental restrictions that are worthwhile taking into account.
The total length of the array cables and budget will update automatically.
Extension of AC transmission modeling with a shunt reactor
When you are using an AC high-voltage transmission in your offshore wind park scenario, you can now add shunt reactors on your offshore substations and to the onshore substation.
You can do this by using the checkbox Use a shunt reactor on the offshore substation.
Or/And by using the checkbox Use a shunt reactor on the onshore substation.
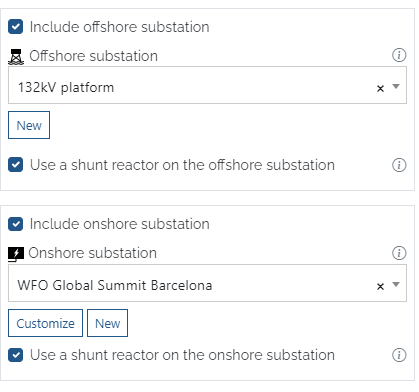
The reactive power MVAr capacity of the shunt reactor is automatically chosen to maximize the efficiency of the export transmission. You can inspect the resulting Total shunt reactor capacity (MVAr) in the Export Cable assumptions, and the improved Export Cable Efficiency (%) in the Efficiency and Availability table.
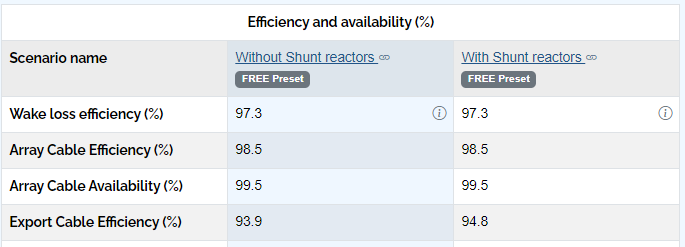
In the example above, the Export cable efficiency without shunt reactors to the left and with shunt reactors offshore and onshore to the right.
The effect of using a shunt reactor will be more significant for AC transmissions covering a longer distance, i.e. when the wind park is further away from the onshore substation.
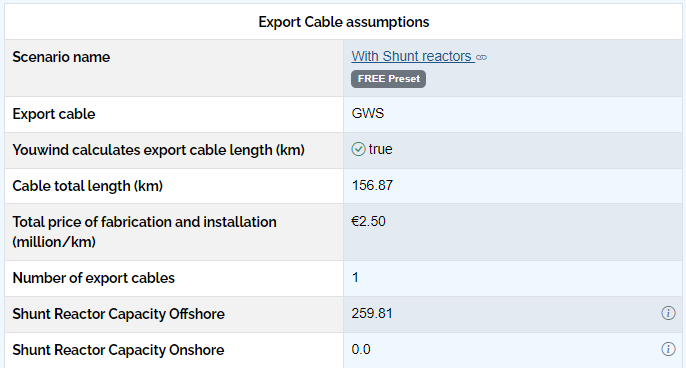
The pricing of the shunt reactor is set at the offshore and onshore substation library item, where you can define the cost function based on the reactor's rated reactive power capacity (MVAr).
The resulting cost of the shunt reactors is included in the CAPEX budget of the scenario, as a subcategory of the Offshore substation cost and the onshore substation cost.
This feature was made in collaboration with CITCEA-UPC and IREC, with the funding support of Innotec, a funding line of ACCIÓ to promote innovative projects, from the Generalitat de Catalunya.
Updated LCOE table
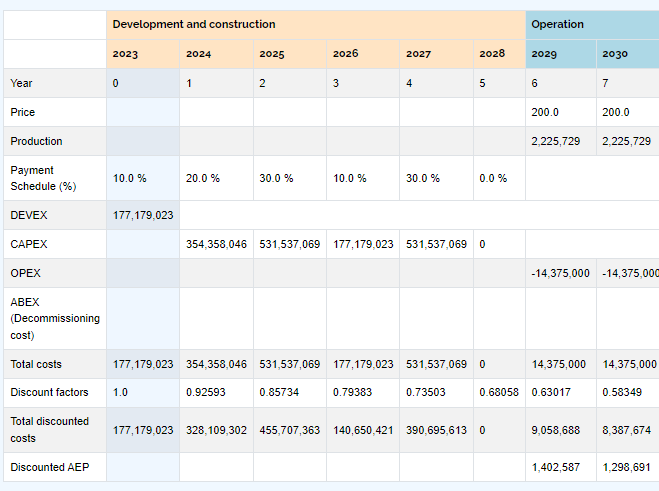
Under the finance tab in scenario overview and finance, there is a table with the details of LCOE (levelized cost of energy) calculations.
Overall LCOE figures can be found in this detailed table and will be affected by the user's choices of Real Year, FID year, development time, payment schedules, and actual production. This table shows how the DEVEX, CAPEX, OPEX, ABEX, Production, and discount factors influence the overall final figure of the LCOE.
Wind Map Visualization
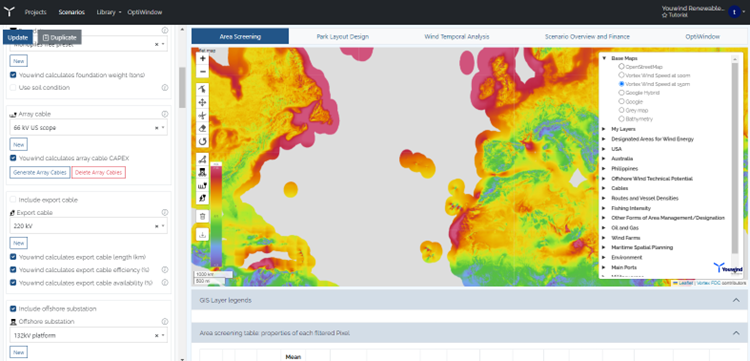
It is now possible to visualize the wind resource in the Area Screening section by selecting the wind map at different heights, 100m or 150m which is provided by Vortex.
Updated wind farm areas in Colombia, and South Africa among many more emerging markets
This month Youwind has been updated with the latest possible areas and GIS restrictions for emerging markets.
The updated zones can be added to your scenario under GIS layers where you can search for the following layers to add to your project:
| Azerbaijan | Protected Areas |
| Barbados | Protected Areas |
| Colombia | RAMSAR |
| Colombia | Marine Protected Areas |
| Colombia | Reefs |
| Colombia | Fishing Ground |
| Colombia | DIMAR proposal |
| Colombia | General Nomination Area |
| Dominican Republic | Protected Areas |
| Greece | Offshore wind farm development areas |
| Namibia | Harbours |
| Namibia | Protected Areas |
| Namibia | Onshore Power Plants |
| Namibia | National Parks |
| South Africa | Marine Protected Areas |
| South Africa | Conservation Areas |
| South Africa | Protected Areas |
| South Africa | Proposed Fisheries Support Zones |
| South Africa | Designed Renewable Energy Areas |
| South Africa | Seismics |
| Turkey | Protected Areas |
| Ukraine | Protected Areas |
| Uruguay | Priority Marine Sites |
| Uruguay | RAMSAR |
| Vietnam | Protected Areas |
| World | Continental margins |
| World | Reefs at Risk |
| World | Emission Control Areas of Sox and Nox |
| World | Exclusive Economic Zones |
About Youwind Renewables
Youwind is a web-based solution for accelerating offshore wind development.
Founded in 2018 by industry engineers with over 15 years of experience in offshore wind development, Youwind's innovative technology streamlines and optimizes the initial phases of offshore wind project development, reducing early-stage development timelines by 80%.
By leveraging our database, critical decision-making in project development, including design, can be rapidly made. We look at offshore wind developments holistically as our approach integrates engineering and cost data to efficiently model key technical and financial indicators and assess the viability of projects.
To find out more request a demo now.

.png?width=624&height=427&name=MicrosoftTeams-image%20(2).png)