Many users needed to have implemented uncertainty calculations to their scenarios so we went right ahead and added that to the YOUWINd scenario comparisons.
Our calculated figure for electricity production is the P50 AEP. This figure is the level of production that is estimated to be exceeded 50% of the time in a year or the average in a year. A P90 figure is therefore an estimate of production that is forecasted to exceed 90% of the time in a year. The P stands for percentile. The YOUWINd model P50 value is the mean value that represents the AEP with the highest probability.
The AEP estimate varies from year to year as we don‘t know the future wind speeds and therefore we always include uncertainties in our calculations. These include uncertainties in our own modeling and the data itself. No developer can promise that the wind farm site will not have years that will underperform. Like in Youwind Model as in other calculation models, the distribution of uncertainty does not perfectly follow normal (Gaussian) distribution but for the sake of simplifying calculation, we use this distribution. We do this because we use the mean wind speed with 10-minute intervals at 100m hub height and statistically representative data is not always available.
Therefore we have also the P90 figure shown for the AEP which is more used by investors that want a more viable estimate of the production over the lifetime of the wind farm. In the graph below we show the AEP with P50 and P90 for a typical wind farm production estimate.

The turbine’s power output is entered for each wind speed. The result of this calculation is the AEP or annual energy production.
Depending on the reliability of the original data, turbine height, turbine design, the variability in the weather, and maintenance or breakdown history, you will have a likelihood or probability that the actual energy output will be less than the calculated AEP.
Causes of uncertainty:
The calculation of the scenarios from the best estimate of the P50 takes the total uncertainty into account that has been involved in the AEP modeling in the YOUWINd model.
These are the following:
- Data uncertainties – Weather data from our data source = Xdata = 5%
- Interannual variability – Weather changes year to year = Xweather = 5%
- AEP calculation model – calculation uncertainty = Xmodel = 4%
When you combine the uncertainty with the factors we can calculate the P90 using the normal distribution model. When combining the uncertainty models we calculate them as independent from each other and then we can calculate the overall uncertainty in the modal as:
Our overall uncertainty is valued at 8,1% in our probability calculations. There are many ways of lowering this uncertainty but this implies more accurate datasets.
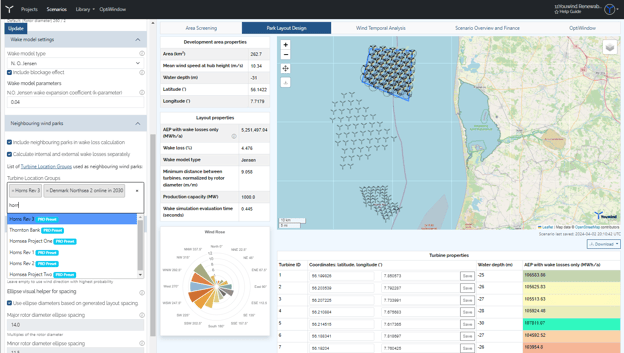
With this uncertainty, we can evaluate our probability normal distribution. Let‘s have a look at an example with the Borssele 1+2 Example scenario that is the first on the list in the free version of Youwind Model (app.youwindmodel.eu). The distribution level can be seen in the figure below:
The result of the P90 and the P50 can be seen on the scenario overview page but the overall calculation is based on the P50 calculations.
Try it for yourself using your own data and make your own scenarios using the YOUWINd model. Try it out here: app.youwindmodel.eu